Interactive
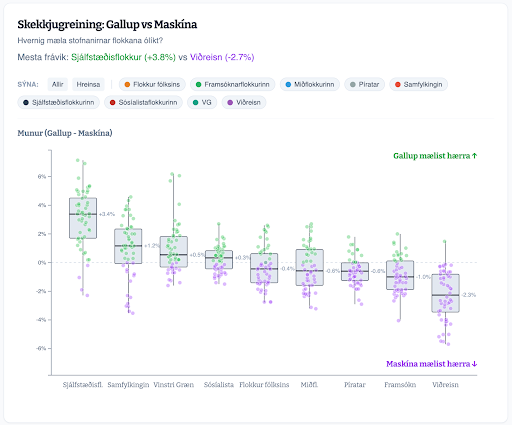
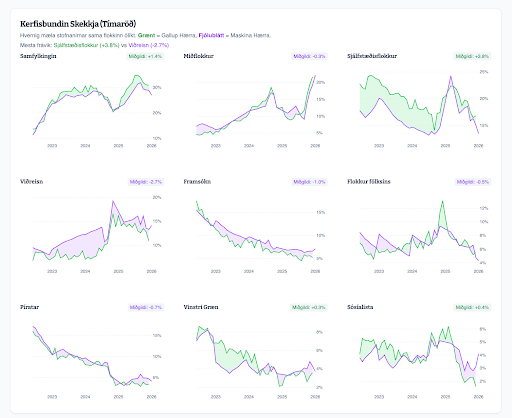
Data story
Climate indicators explorer
A lightweight exploration tool that helps non-technical stakeholders ask better questions.
One-person data viz studio
Data visualization, exploratory analysis, and clear communication for teams that ship. Based in Reykjavík, Iceland.
Short projects, sharp visuals, and a bias toward shipping. Replace the placeholders with your real work as you go.
A lightweight exploration tool that helps non-technical stakeholders ask better questions.
A single page that reduces reporting overhead and surfaces the few numbers that matter.
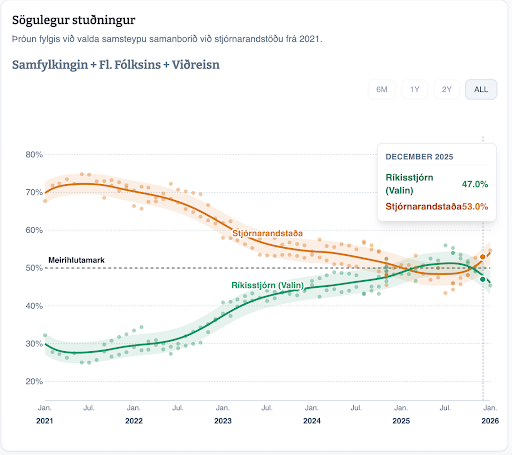
A narrative piece with annotated charts, designed to be shared internally.
A simple menu, adapted to your context.
Turn messy data into a clear narrative and a chart system you can reuse.
Practical dashboards that stay fast, readable, and hard to misinterpret.
Rapid iteration to find the signal, with reproducible outputs.
FYI Lab is a solo practice. The best projects start with a short brief and a quick call.
Email hello@fyilab.isReplace this email address with your preferred contact.
Real-life signals that your data could be doing more work for you.
If credit, product, and compliance don’t agree on definitions, the dashboard becomes a debate instead of a tool.
If your results need a footnote every time, it’s time for visuals that show margins, segments, and change over time.
If you’re exporting spreadsheets weekly, the system is asking for automation and a clearer hierarchy.
If the chart needs narration to be safe, you likely need better annotation, scales, and accessible defaults.
If analysis lives in one person’s laptop, you need reusable templates and a reproducible workflow.
If it’s hard to see what changed and why, you need structure: comparisons, targets, and a story thread.